Drying and Carbonization
COLUMN 12How Much Can Carbonization Reduce Waste Weight? Evidence from 13 Bench Tests
How do feed type and test conditions affect weight before and after heating? We compare 13 small-scale trials.
Contents of this article
01Carbonization principles and bench-test methods
Carbonization heats feedstock under restricted oxygen supply, thermally decomposing organic matter into solid residue, gases and other products. Feed moisture also evaporates during heating. Feed composition and temperature affect both the remaining solids and the characteristics of the gas.
Carbonization and incineration differ in oxygen supply and purpose. An equipment assessment should cover safe treatment of the gas and vapor as well as the carbonization reactor itself.
Heating conditions and evaluation items depend on sample properties.
The samples were heated in a small furnace and weighed before and after treatment. Most tests used a nitrogen atmosphere. The catalyst test used a carbon dioxide/nitrogen mixture for the final 50 minutes of holding at 900°C, so its conditions differ from the other tests.
Drying mainly removes moisture, whereas carbonization promotes thermal decomposition of organic constituents under restricted oxygen supply. Moisture also evaporates in a carbonization furnace; therefore the total weight difference cannot be attributed entirely to decomposition. Whether to install a separate dryer depends on feed moisture, throughput, heat supply and handling characteristics.
02Results and before/after photographs from 13 trials
Weight reduction relative to the as-fed weight ranged from 7.45 to 86.75%. These figures include evaporation and do not represent decomposition of the feed alone.
Based on as-fed weight, including evaporation. Different test conditions prevent a like-for-like performance comparison.
| Sample | Moisture | Temperature / time | Before → after heating | Weight reduction |
|---|---|---|---|---|
| Straw pellets | 7.64% | 750°C / 30 min | 855 → 330 g | 61.40% |
| Palm fiber | 11.82% | 700°C / 30 min | 380 → 97.869 g | 74.25% |
| Bamboo chips | 6.56% | 200°C / 120 min → 600°C / 120 min | 610 → 155.096 g | 74.57% |
| Wood A5 | 9.77% | 500°C / 10 min | 130 → 40 g | 69.23% |
| Wood B | 10.31% | 550°C / 7 min | 185 → 50 g | 72.97% |
| Copper-bearing sludge | 0.60% | 600°C / 30 min | 830 → 110 g | 86.75% |
| Domestic sludge | 81.35% | 600°C / 10 min | 830 → 130 g | 84.34% |
| Waste from Japan | 39.29% | 750°C / 5 min | 655 → 140 g | 78.63% |
| Oil residue | 0.73% | 750°C / 30 min | 740 → 515 g | 30.41% |
| Waste salt | 2.62% | 650°C / 30 min | 281.316 → 260.351 g | 7.45% |
| Catalyst | 2.13% | 900°C / 80 min | 177.183 → 124.475 g | 29.75% |
| Electronic board | 3.60% | 800°C / 30 min | 570 → 250 g | 56.14% |
| Board C | 0.15% | 750°C / 30 min | 1770 → 1440 g | 18.64% |
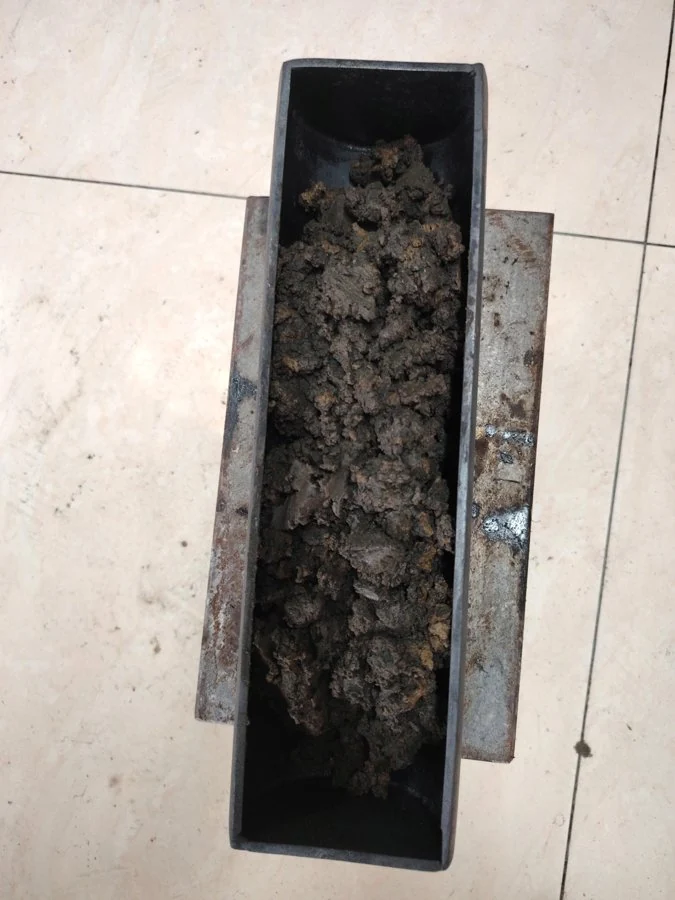
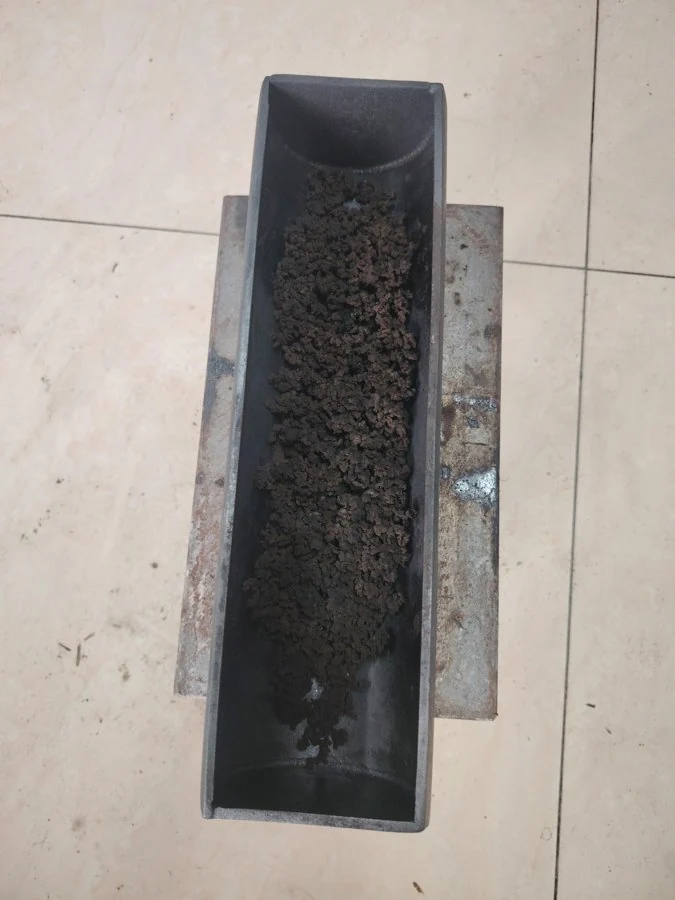
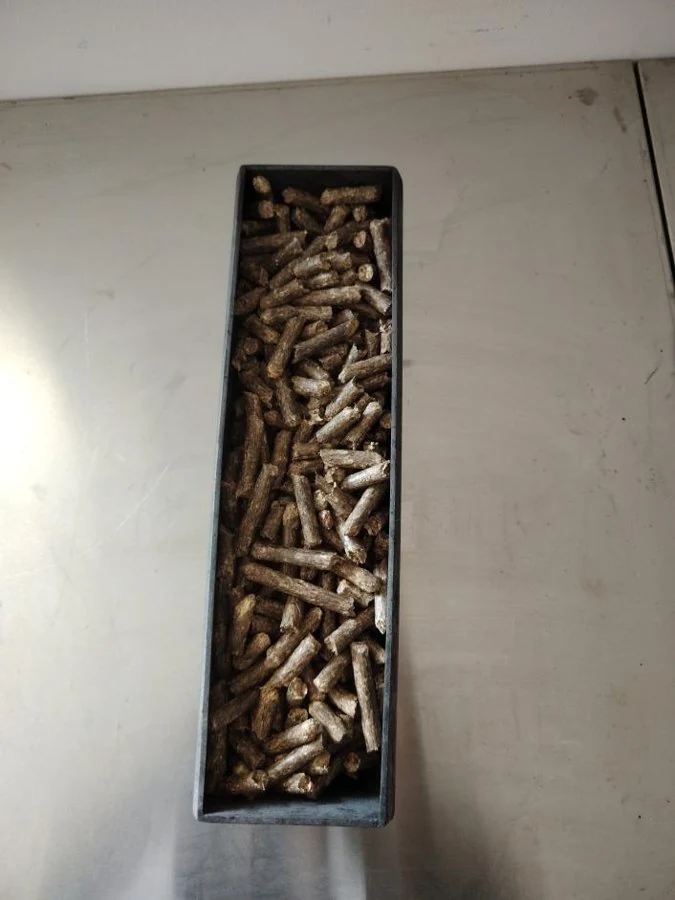
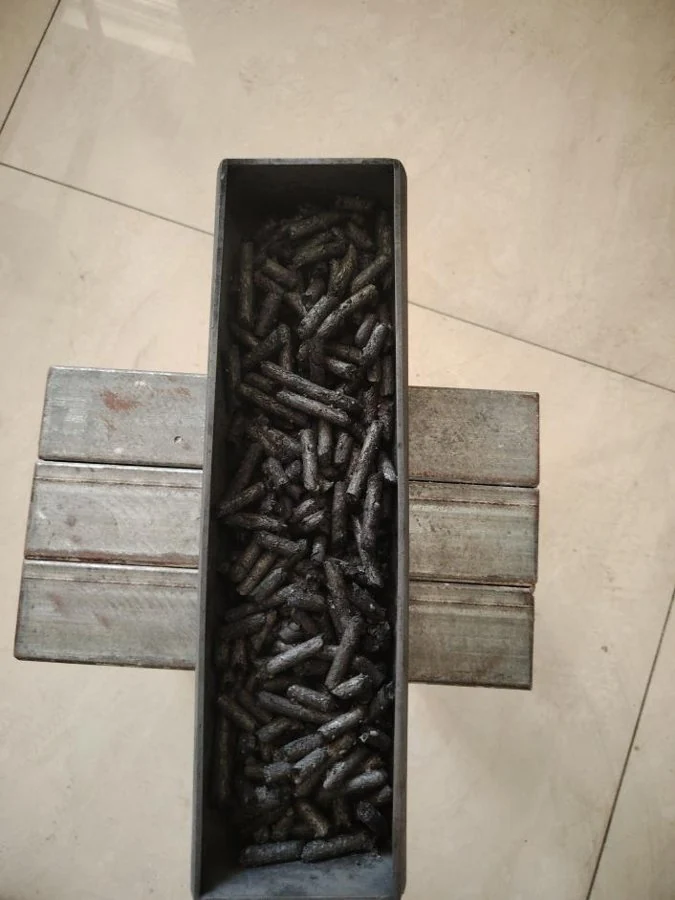
Plant feedstocks contain fibrous organic matter. Sludge can have widely varying proportions of water, ash, organics and metals depending on its source. Electronic boards combine resins and fibers with metal components. Their different proportions of constituents remaining as solids mean that weight reduction alone cannot establish ease of treatment.
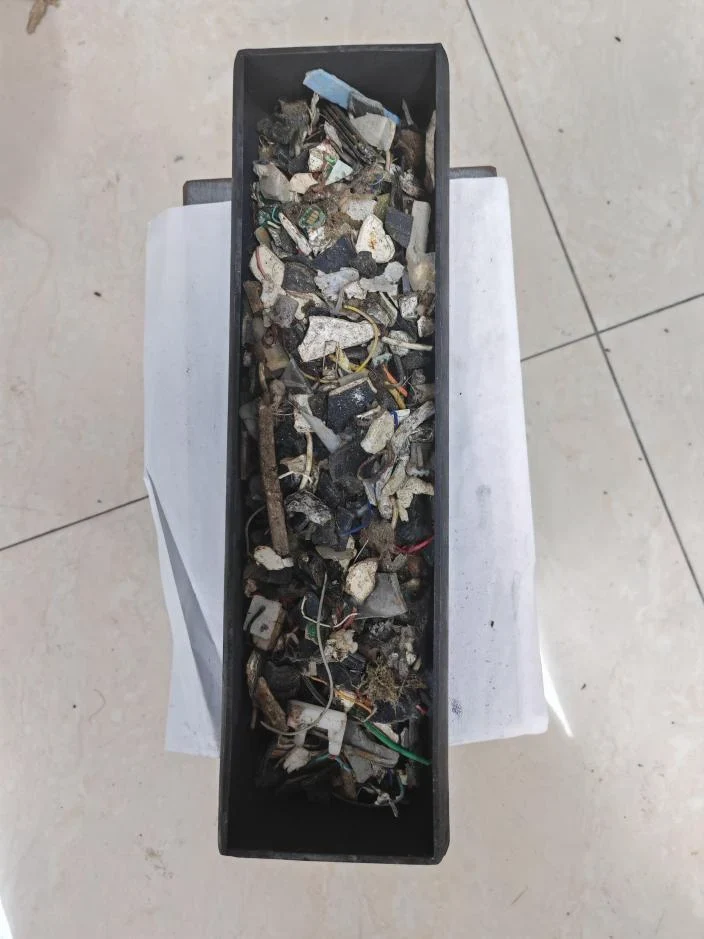
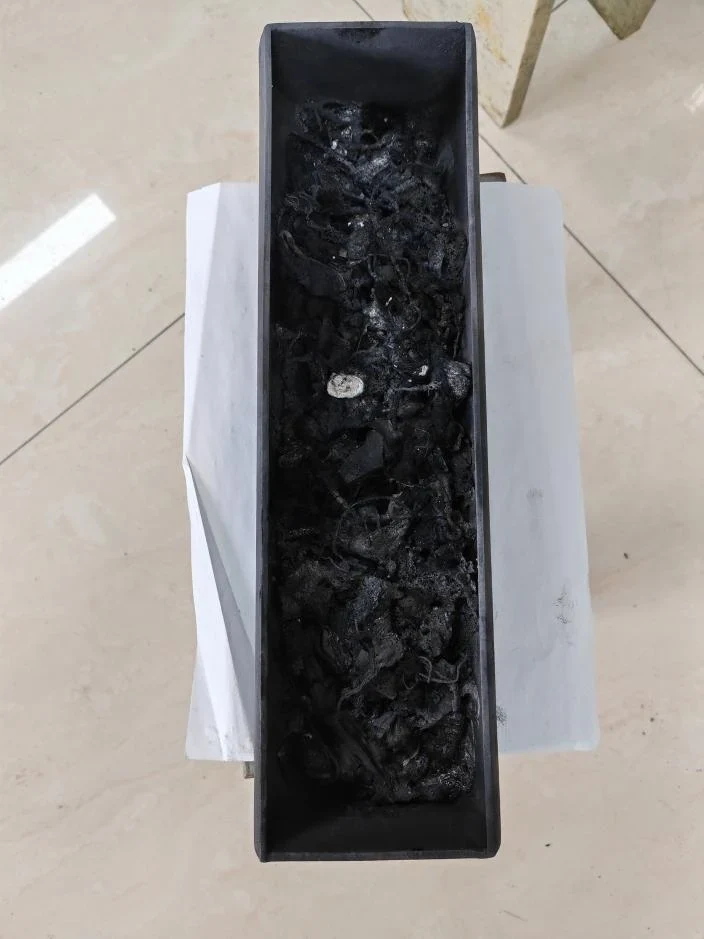
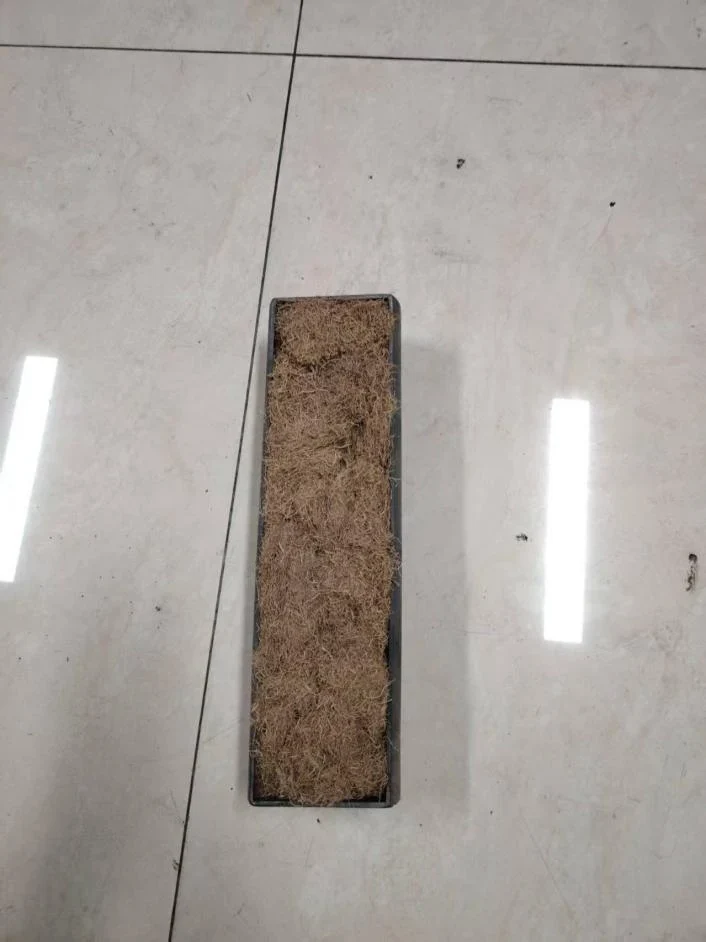
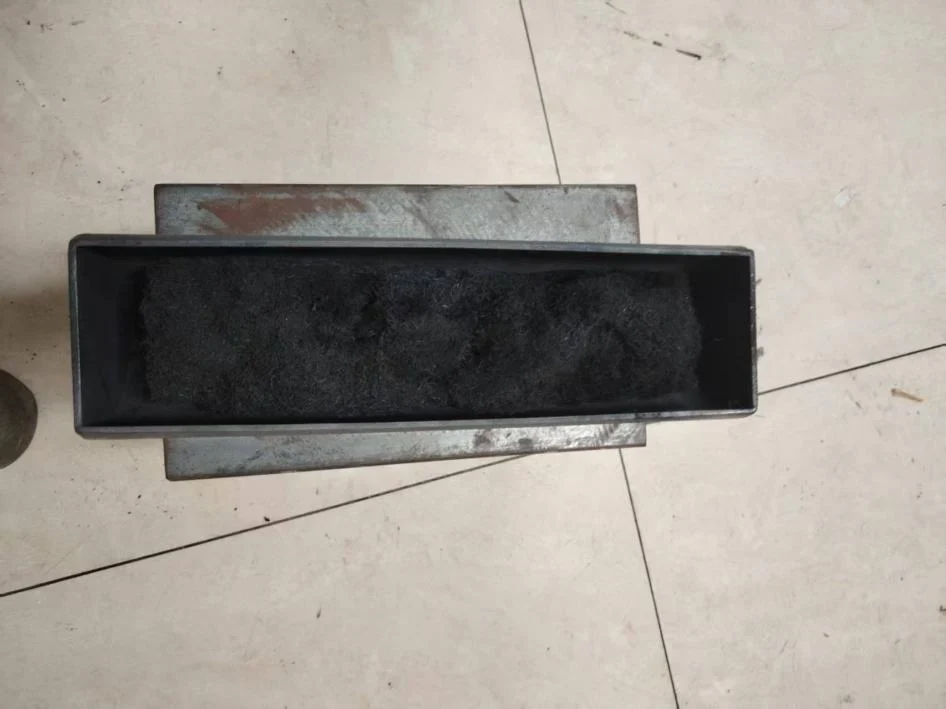
The 13 samples comprise five plant/wood samples, two sludges, two electronic-board samples and four other materials. Results vary even within a category. The large difference between the two board samples suggests that differing proportions of metals, resins and glass fibers should be considered, but the test values alone do not establish the cause. The categories aid interpretation and do not guarantee feed suitability or product quality.
| Category | Tests | Weight-reduction range |
|---|---|---|
| Plant / wood | 5 | 61.40–74.57% |
| Sludge | 2 | 84.34–86.75% |
| Electronic boards | 2 | 18.64–56.14% |
| Other materials | 4 | 7.45–78.63% |
03Interpreting moisture and weight reduction
Weight reduction is the difference between the before- and after-heating weights divided by the before-heating weight. Domestic sludge decreased from 830 g to 130 g, equivalent to 84.34%. However, the feed moisture was 81.35%, so the change includes evaporation.
Copper-bearing sludge had 0.60% moisture and 86.75% weight reduction. Because properties and test conditions differ, these two tests do not show that moisture alone determines weight reduction. Feed analysis and a product mass balance are also required.
The charged weight is normally the wet weight, including water. If M is the wet feed mass and w its wet-basis moisture fraction, input water is M×w and input dry solids are M×(1−w). Divide moisture percentage by 100 to obtain w.
The before/after difference is an apparent change that includes evaporation, release of volatile constituents and discharge of reaction products. If feed and residue moisture are measured, dry-basis solids yield can be calculated as dry residue mass divided by input dry-solids mass, multiplied by 100. Sampling losses and mass exchange with reaction gases must also be considered.
Without residue moisture measurements, dry-basis solids yield and organic decomposition cannot be determined. Feed moisture, ash and volatile matter help interpret the measured weight change.
Wet-basis moisture divides water mass by wet feed mass; dry-basis moisture divides water mass by dry-solids mass. For example, 80% wet-basis moisture equals 400% dry-basis moisture. Confusing the two changes calculated water removal and heat balances substantially, so the basis must be identified in calculations and test results.
Weight reduction uses wet feed mass as its denominator, while dry-basis solids yield uses input dry solids. Treating wet residue as dry solids overestimates yield. For mineral-rich feedstocks, ash can be a major part of the residue, making separate evaluation of ash and organic matter important.
Each point represents a different sample and test condition. The plot does not establish correlation or causation.
The residue fraction relative to wet feed equals 100 minus the weight-reduction percentage. Dry-basis solids yield additionally requires residue moisture. Keeping these indicators separate distinguishes reduction of transport/disposal weight from assessment of organic thermal decomposition. Clarifying whether the objective is feed reduction or char quality also defines the required tests.
04From bench results to equipment assessment
Moisture, composition, temperature and holding time differ, so reduction percentages alone cannot rank materials or establish full-scale performance. Times in the table are carbonization or holding times and do not necessarily include heating and cooling.
Equal furnace settings do not ensure equal internal sample temperatures. Thickness, particle size, charge mass, heat-transfer method, heating rate, holding time and atmosphere-gas flow affect heat transfer and reaction. Holding time must be distinguished from the total cycle including heating and cooling.
Small-scale carbonization tests are useful initial investigations of material changes and product properties. Results for a small charge cannot be directly converted into continuous throughput, electricity demand or equipment cost.
Equipment assessment should establish daily and peak feed quantities, moisture variability, particle size, contaminants, pretreatment, gas composition, char analysis and the destination of products. Additional representative samples and test conditions can progressively define design requirements.
Holding time means continued heating at a specified temperature, separately from heat-up and cooling. Sample thickness and packing may cause differences between furnace settings and internal temperatures. Temperature measurement location, the criterion for reaching the setpoint, atmosphere and cooling method should all be specified.
A mass balance distinguishes solid residue, water vapor/pyrolysis gas, condensate and collected dust. Gas and condensate depend on feed moisture and constituents and are important for gas and wastewater treatment design. Where the small-scale tests did not measure every stream, an additional measurement plan is needed.
Continuous equipment requires assessment of feed variability, stable feeding, residence time, sealing, adhesion/blockage and heat losses as well as throughput. These tests are a starting point for feasibility; actual feedstock investigations are required to establish capacity and operating cost.
Initial sampling should include higher-moisture and higher-contaminant conditions as well as typical operation. One average sample does not establish sustained performance. Recording feed rate, temperature, residue and gas conditions over time identifies start-up and steady-state variation and cleaning/inspection needs. Operational stability is as important as throughput in continuous trials.
For quotations, specify throughput units, operating hours, feed analysis and form, residue acceptance conditions, available electricity/heat and installation space. Include destinations for gas, condensate and solids. Individual bench tests identify additional measurements needed to define these conditions; they are not standardized comparisons of different feedstocks or equipment.