
Drying and Carbonization
COLUMN 14Electronic-Board Carbonization and Metal Recovery: Crushing and Separation Trial Results
Electronic boards combine resins, glass fibers and copper. We examine carbonization weight changes and a separate separation trial.
Contents of this article
01Electronic-board challenges and two carbonization tests
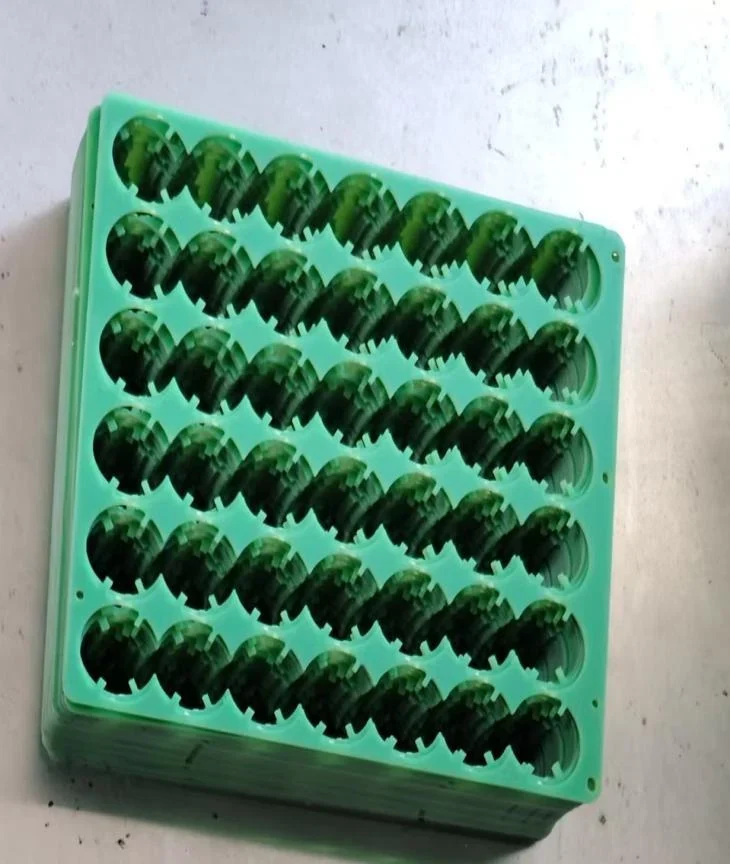
Waste electronic boards combine metals such as copper, resins, glass fibers and components. Composition varies with equipment type and dismantling method, so residue properties and separation behavior are not uniform even for materials called electronic boards.
Carbonization assessment must integrate pre-crushing/contaminant removal with treatment of heating gas, dust, odor and residue.
| Sample | Moisture | Temperature / time | Before → after heating | Weight reduction |
|---|---|---|---|---|
| Electronic board | 3.60% | 800°C / 30 min | 570 → 250 g | 56.14% |
| Board C | 0.15% | 750°C / 30 min | 1770 → 1440 g | 18.64% |
Based on as-fed weight, including evaporation. Different test conditions prevent a like-for-like performance comparison.
Board C weighed 1,440 g after carbonization. Crushing and 40-mesh screening produced 575 g coarse and 750 g fine material, totaling 1,325 g. The 115 g difference has not been allocated, so it cannot be used to calculate individual process recoveries.
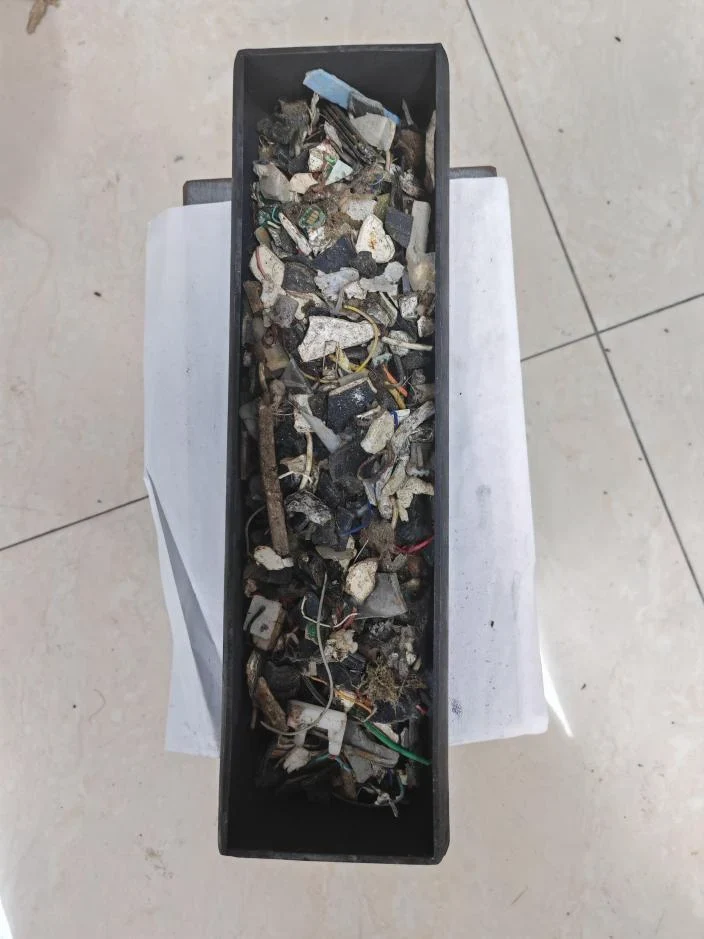
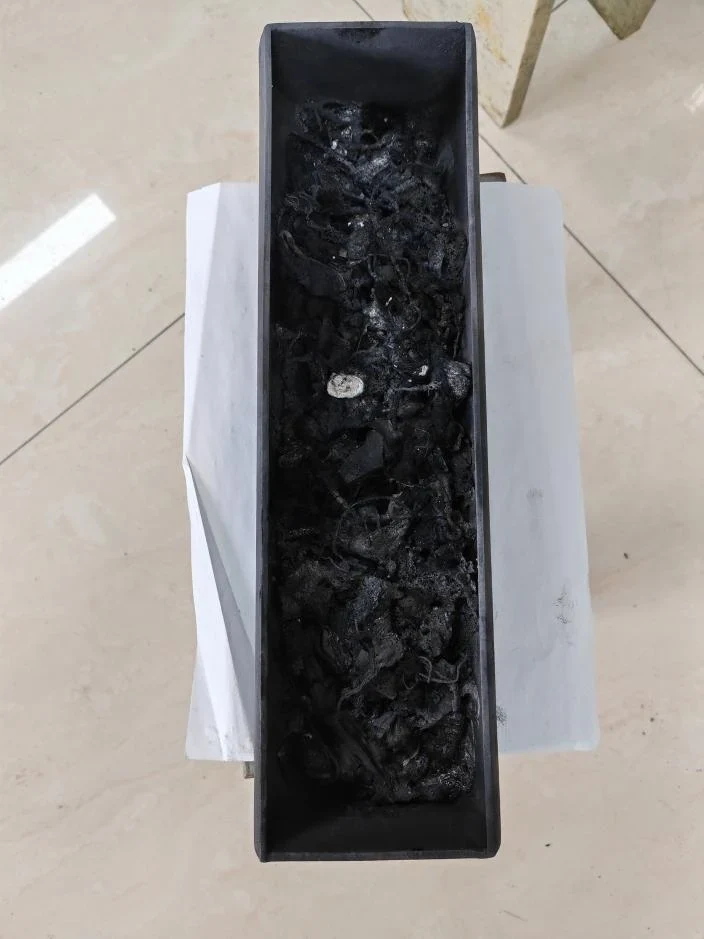
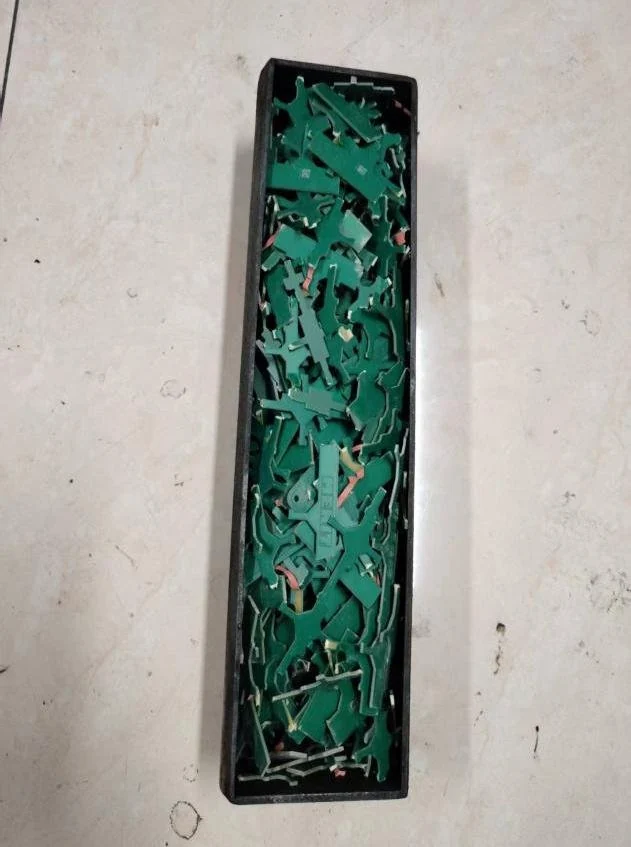
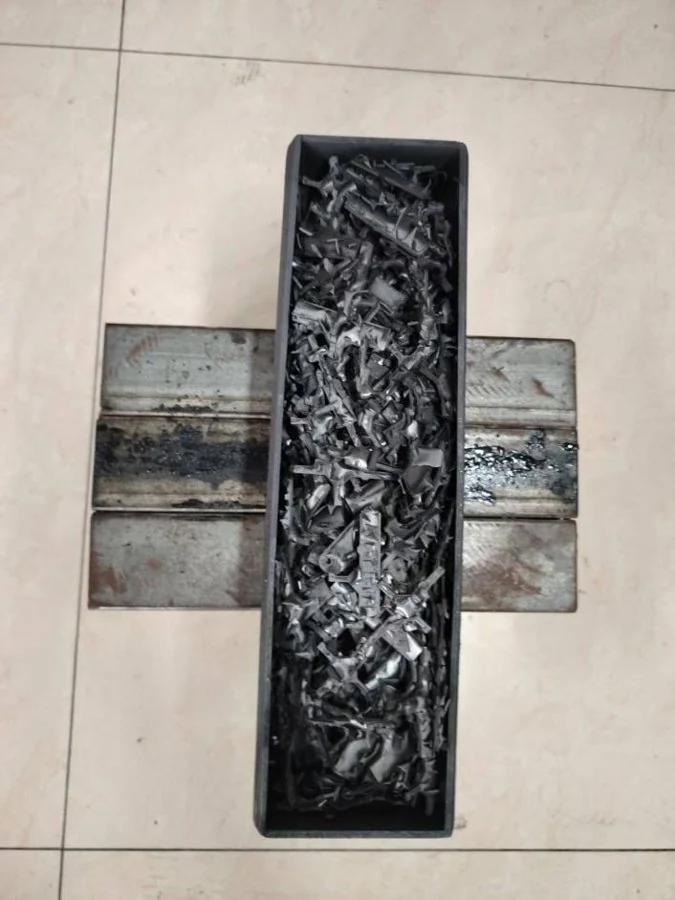
Boards contain conductors such as copper, resins, glass fibers, solder and components. Material/metal proportions vary with manufacturing period and application, as does the condition after dismantling/crushing. Heating-related weight change must therefore be assessed separately from the grade of subsequently separated metals.
02Crushing and metal separation of char
Branches show magnetic material, copper powder and tailings. Specific dust-collection connections have not been confirmed.
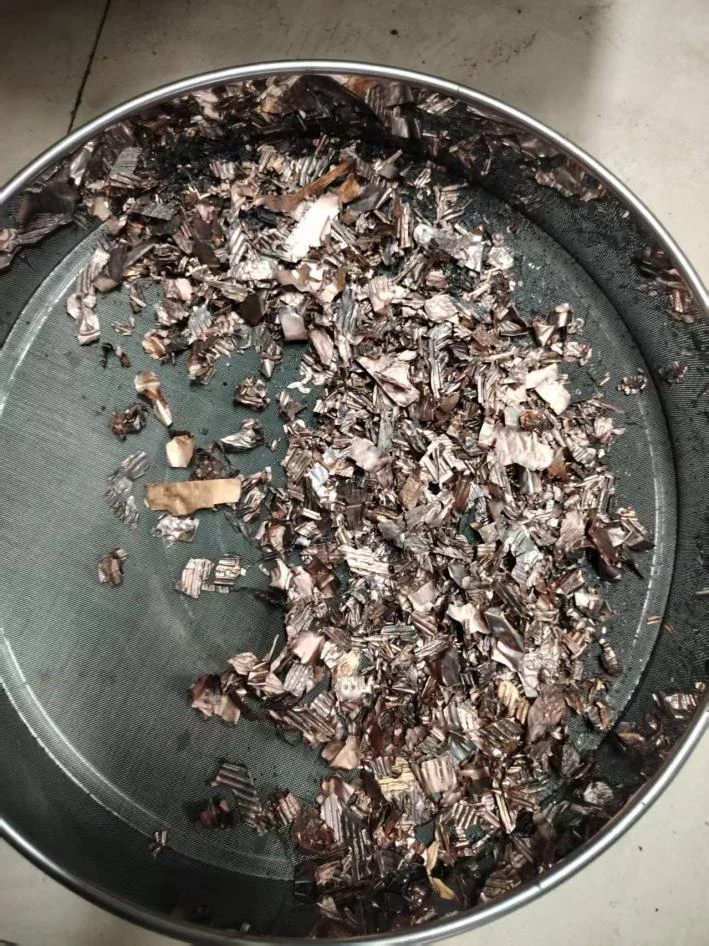
A separate metal-separation test used crushing, magnetic separation, milling, vibrating screening and gravity separation. Magnetic separation removes magnetic material; screening separates by particle size; gravity separation uses density and other differences.
The values 14 kg, 12.9 kg after crushing and 11.35 kg after magnetic separation are recorded process weights. Because they include equipment hold-up and removal of magnetic materials, the differences are not entirely metal losses, nor is 11.35 kg a recovered-metal quantity.
Board char may contain heterogeneous metal fragments and resin-derived residues with differing particle sizes/densities. Before treating a few measurements as the average for the whole lot, confirm sample division, particle size, number of sampling points and analytical-sample uniformity.
Screen aperture and milling conditions determine a particle-size range favorable to separation. Conditions should be assessed using measured grade and recovery, including dust generation and potential metal loss from excessive fine grinding.
Crushing/milling also liberates metals from other constituents. Magnetic separation after crushing removes iron and other magnetic material; milling and vibrating screening then adjust/classify size. Gravity separation is affected by particle size and shape, so density differences alone do not ensure complete separation.
The separate trial recorded 14 kg char, 12.9 kg after crushing and 11.35 kg after magnetic separation. The first difference includes hold-up and uncrushed material, and the second relates to removed magnetic material. Because the complete final balance is unavailable, neither difference is a recovered-metal quantity.
These are process weights, not recovered-metal quantities or recovery rates.
Effective separation requires sufficient liberation of target metal from other materials. Bonded metal/nonmetal fragments can impair gravity or magnetic separation. Finer grinding may also make fine-particle recovery and dust collection harder. Select milling/screening conditions using copper grade, distribution to tailings/dust, throughput and maintenance load.
03Interpreting metal analysis and calculating recovery
After separation, tailings contained 14.45% copper by screening measurement and 17.01% by a separate analysis. Gold was 0.111% by screening measurement and 6 g/t by fire assay. Gold in copper powder was 0.032% by screening measurement and 16.2 g/t by fire assay. These large differences require confirmation of sample representativeness and analytical conditions.
Copper concentrations, not recovery. Analytical methods and sample representativeness require confirmation.
| Fraction | Analysis | Copper % | Gold g/t |
|---|---|---|---|
| Tailings | Screening | 14.45 | 1110 |
| Tailings | Other analysis / fire assay, etc. | 17.01 | 6 |
| Copper powder | Screening | 94.83 | 320 |
| Copper powder | Other analysis / fire assay, etc. | 88.51 | 16.2 |
Metal content is the fraction of a target metal in the analyzed sample. Recovery is the fraction of the target metal initially present in the feed that is recovered into the intended product.
Recovery requires weights and target-metal concentrations for feed and products, together with a mass-balance assessment. High copper-powder grade alone cannot establish total recovered quantity or recovery.
For mass concentration, 1% equals 10,000 mg/kg, and mg/kg and g/t have the same numerical value. Thus 6 g/t gold equals 0.0006% and 16.2 g/t equals 0.00162%. Comparisons must use consistent units, moisture bases and product fractions.
For example, copper recovery is product mass×copper content divided by feed mass×copper content, multiplied by 100. Representative samples and balances should include copper powder, tailings, magnetic material, dust and equipment hold-up. The complete balance needed to establish final recovery has not been confirmed for this trial.
Grade is the target metal's fraction of a separated product; recovery is the fraction of input metal reporting to that product. High copper grade can coexist with low recovery if substantial copper remains in tailings or dust.
Recovery calculation requires feed mass/copper concentration and copper-powder mass/copper concentration. Measuring tailings, magnetic material, dust and hold-up additionally helps assess unaccounted mass and analytical variation. Heterogeneous feed requires suitably mixed and divided representative samples.
Compare analytical methods by target element, detection limit, preparation, measurement count and reporting basis. Rapid screening is useful, but a small number of point measurements on heterogeneous material cannot establish the whole-lot mean. Gold evaluation requires appropriate analysis of representative samples.
Do not mix wet weights with dry-basis concentrations. Confirm each fraction's moisture/reporting basis and convert consistently before calculating metal mass. Combining different samples or separate trials may over- or underestimate apparent recovery. The two carbonization samples and the 14 kg separation trial are not treated as a single-batch linked mass balance.
04Representative sampling and safety
Differences between rapid screening and fire assay require assessment of sampling, uniformity and representativeness as well as analytical method. Precious metals can be unevenly distributed; review sample preparation and the laboratory report before using results for project economics.
Gas treatment should account for feed resins/additives and measured gas composition. Both heating and crushing/separation require assessment of dust, odor, fire prevention and working conditions.
Heating resin/additive-containing boards requires feed-specific gas analysis. Milling/screening also generates dust, requiring assessment of collection, enclosure, fire prevention and workplace conditions. Gas/dust treatment must suit actual feed and operating conditions.
Sampling should consider settling metal fragments and segregation of light powders. Record sampling location/quantity, mixing/division and pre-analysis milling so results can be reassessed. Reproducibility assessment should distinguish instrument uncertainty from feed heterogeneity. A discrepancy between screening and detailed analysis does not establish that one method is always correct.
Economic assessment must not equate metal content with saleable recovered quantity or profit. Check acceptance conditions for each separated fraction, refining/disposal requirements and operating cost. Reassess separation conditions when feed origin/properties change. This article does not establish actual gold, silver or copper recovery quantities or profit; assess carbonization, crushing/separation, analysis and final dispatch as a complete process.